Spring Boot 应用监控最佳实践之Micrometer
前言
Spring Boot应用监控有很多方案,例如elastic APM,Prometheus等。各有特色,本次实践采用方案:Micrometer+Prometheus+Grafana。
选择Micrometer最重要的原因是他的设计很灵活,并且和spring boot 2.x集成度很高。对于jvm的监控很容易集成,难度很小。本次实践包含jvm监控和业务性能指标监控。
环境准备
搭建promethues
1
2
3
4
5
docker run \
-p 9090:9090 \
--name prometheus
-v /tmp/prometheus.yml:/etc/prometheus/prometheus.yml \
prom/prometheus1
2
3
4
5
6
7
8
9
10
11
12
13
14
15
16
17
18
19
20
21
22
23global:
scrape_interval: 15s # By default, scrape targets every 15 seconds.
evaluation_interval: 15s # By default, scrape targets every 15 seconds.
# scrape_timeout is set to the global default (10s).
# Load rules once and periodically evaluate them according to the global 'evaluation_interval'.
rule_files:
# - "first.rules"
# - "second.rules"
# A scrape configuration containing exactly one endpoint to scrape:
# Here it's Prometheus itself.
scrape_configs:
# The job name is added as a label `job=<job_name>` to any timeseries scraped from this config.
- job_name: 'demo_platform'
# Override the global default and scrape targets from this job every 5 seconds.
scrape_interval: 5s
metrics_path: '/actuator/prometheus'
# scheme defaults to 'http'.
static_configs:
- targets: ['127.0.0.1:8080']搭建grafana
1
docker run -d -p 3000:3000 --name grafana grafana/grafana:6.5.0
Micrometer简介
![]()
Micrometer(译:千分尺) Micrometer provides a simple facade over the instrumentation clients for the most popular monitoring systems. 翻译过来大概就它提供一个门面,类似SLF4j。支持将数据写入到很多监控系统,不过我谷歌下来,很多都是后端接入的是Prometheus.
Micrometer提供了与供应商无关的接口,包括 timers(计时器), gauges(量规), counters(计数器), distribution summaries(分布式摘要), long task timers(长任务定时器)。它具有维度数据模型,当与维度监视系统结合使用时,可以高效地访问特定的命名度量,并能够跨维度深入研究。
支持的监控系统:AppOptics , Azure Monitor , Netflix Atlas , CloudWatch , Datadog , Dynatrace , Elastic , Ganglia , Graphite , Humio , Influx/Telegraf , JMX , KairosDB , New Relic , Prometheus , SignalFx , Google Stackdriver , StatsD , Wavefront
Micrometer提供的度量类库
Meter是指一组用于收集应用中的度量数据的接口,Meter单词可以翻译为”米”或者”千分尺”,但是显然听起来都不是很合理,因此下文直接叫Meter,理解它为度量接口即可。Meter是由MeterRegistry创建和保存的,可以理解MeterRegistry是Meter的工厂和缓存中心,一般而言每个JVM应用在使用Micrometer的时候必须创建一个MeterRegistry的具体实现。Micrometer中,Meter的具体类型包括:Timer,Counter,Gauge,DistributionSummary,LongTaskTimer,FunctionCounter,FunctionTimer和TimeGauge。一个Meter具体类型需要通过名字和Tag(这里指的是Micrometer提供的Tag接口)作为它的唯一标识,这样做的好处是可以使用名字进行标记,通过不同的Tag去区分多种维度进行数据统计。
Spring Boot集成
与spring boot 集成,这里的metric主要是由spring actuator 提供
安装
1 | <dependency> |
配置
1 | management: |
这里有几个注意的点management.endpoint.health.enabled只是为了禁用spring 默认的健康检查,非必须。exclude: env,beans也不需要配置,只是在我项目中为了减少导出的metric。同理management.metrics.enable也是为了减少收集的数据,使用方法为你定义指标的前缀。
只有management.endpoints.web.exposure.include为必须的,这里也只是为了导出/actuator/prometheus,通过该地址可以访问到响应的metric信息。
可视化
访问 http://localhost:8080/actuator/prometheus 即可看到响应的metric信息。
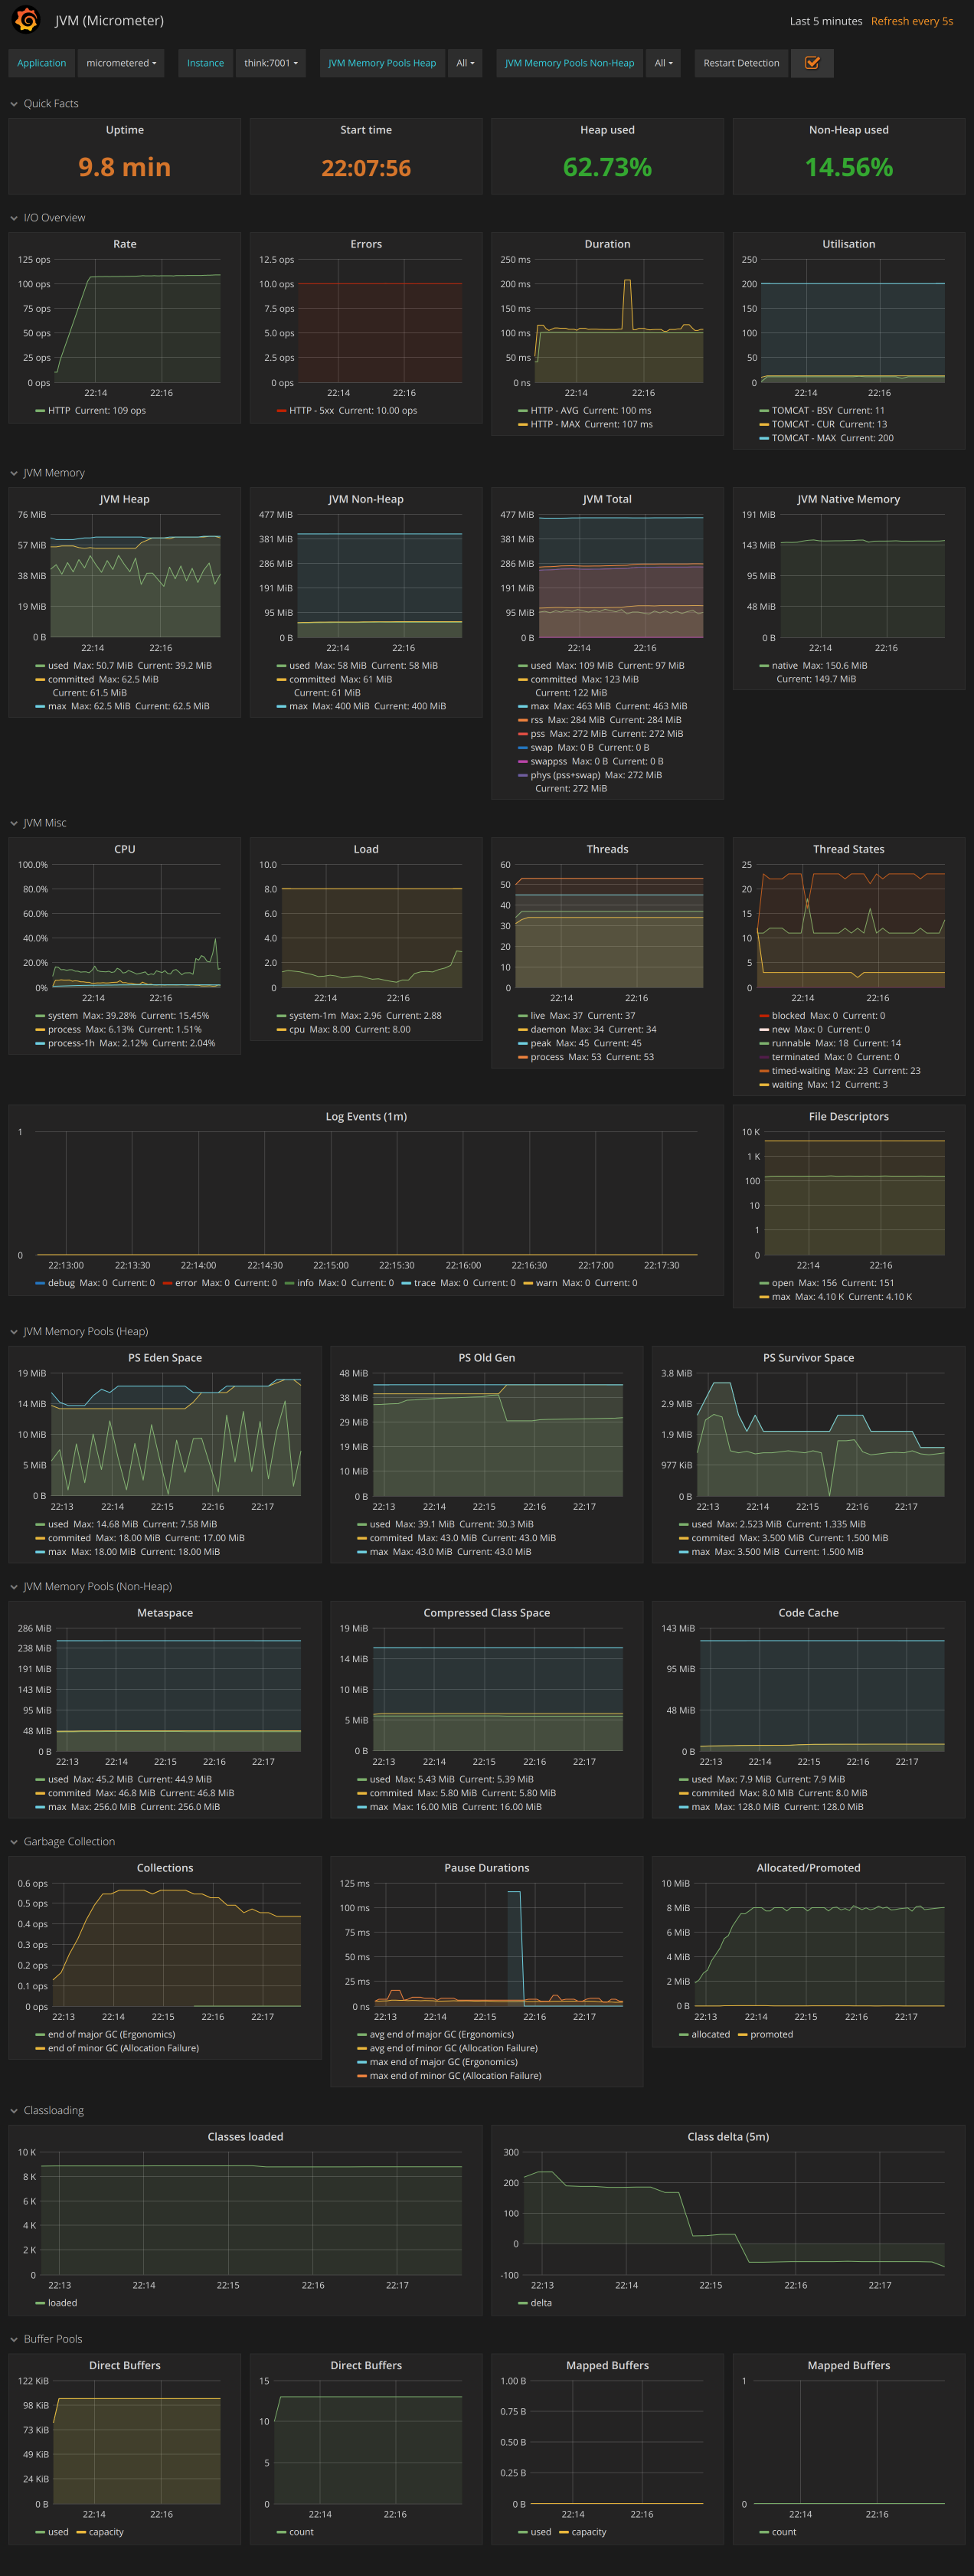
在grafana中中导入JVM (Micrometer)
即可看到如下效果:
自定义业务性能监控
因为系统遗留监控代码的原因,这里采用的是全局静态方法实现。
1 | protected static Iterable<Tag> tags(String service, String category, String method) { |
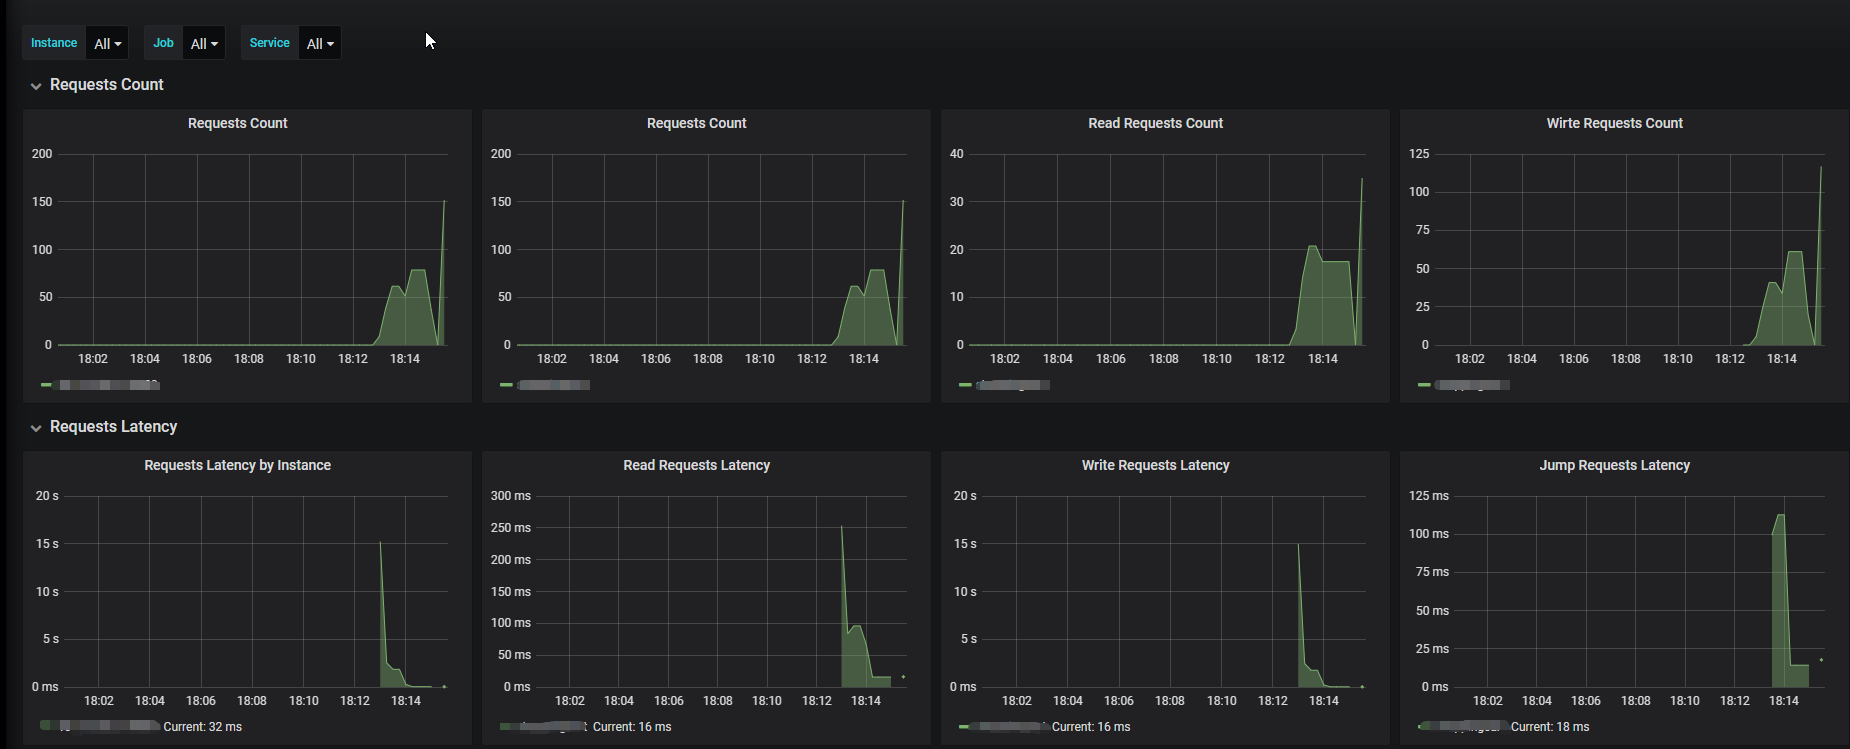
解释一下,这里可以统计出请求数和请求延迟。
对于每秒请求数据量,可以使用increase(http_requests_total{job=~"$job",instance=~"$instance"}[1m])
对于平均请求延迟,可以使用rate(timer_sum[1m])/rate(timer_count[1m])
对于Throughput 可以使用rate(timer_count[1m])
使用中的困惑
问题
Percentile histograms与Distribution summaries性能损失还无法确定,不过查看PrometheusTimer,结合测试,还是有一定的性能损失,不过这里未深入研究。
全局使用一些开发建议
可以在定义静态方法类,初始化的时候做一点配置,registry可以使用spring 注入进来例如:
1 | @Autowired |
1 | public MonitorMetric(MeterRegistry registry) { |